ABS Climate Data Project
Business Analysis | Data Analysis | PowerBI
This sandbox project brief was designed by PWC.
Australian farmers are facing several challenges related to environmental, social, and governance (ESG) issues, with the biggest being climate change, water scarcity and sustainability & conservation. Extract insights from ABS Open Source Agriculture data to provide end-to-end visibility on the status quo of Australian agriculture and any insights that may help to address the key challenges.
Step 1. Exploratory Research
In Australia, our agricultural industry is valued at $90 billion, and provides employment to over 280,000 people nationally. A sustainable agricultural industry is crucial to supporting our population as well as the population of the countries for whom we export to.
Our business problem
Our farmers however, face many current and emerging environmental, social and governance (ESG) challenges that threaten the supply and availability of agriculture. Some of these challenges include increasingly volatile weather patterns, issues around water scarcity and maintaining environmentally sustainable business practice.
Our approach
Through our research, we’ve analyzed data regarding crop production from 2016-2021 and agricultural water usage in 2021. Our ETL process involved extraction of commodity and water source data from the ABS, cleaning through Excel and then using PowerBI to transform and loaded our data.
Step 2. Data Cleaning
In the 2nd step of our project, we cleaned the data by checking for duplicates, create a common of unit of measure across categories and added extra columns e.g broader categories to summarise. This stage was time consuming, and required us to be careful in cleaning a 170,000+ line dataset.
The main challenges we faced during this stage were:
Inconsistent labelling of data. Water related data between 2016-2018 and 2019-2021 were labelled differently and had to be corrected in Excel to ensure all rows could be filtered out in the data exploratory process. Commodity production data was also labelled inconsistently and varied across how granularity. E.g Lentils vs their category Legumes.
Limited data. Data for some commodity categories is limited in some certain states, particularly for Northern Territory and Tasmania. This reduces our ability to provide accurate recommendations. Data for some commodity categories are also sometimes limited or abnormal e.g Sugarcane production is historically only recorded in QLD and NSW (2016-2021), however an WA has collected sugarcane data for one year in 2016.
Limited Scope. This report has limited scope due to constraints in data types. To improve our insights and recommendations, we should bring in and analyse data sets that are closer aligned with the ESG issues. E.g for water scarcity, we can look further into weather & rainfall data, food loss & waste and the food value chain. Additionally this report doesn’t take into account external factors that would influence our data (e.g Natural disasters like floods and bushfires). Thus, our insights and recommendations are limited.
Step 3. Data Exploration
In Step 3, we explored our data by creating as many graphs as we could to draw as many insights as we could. During this step, we sometimes encountered data cleaning issues in which we had to fix as well as limited data in certain categories that we wrote down as limitations.
Exploring Water Sources
First Draft
Step 4. Dashboard
Creation of dashboards on PowerBI.
Step 5: Our findings
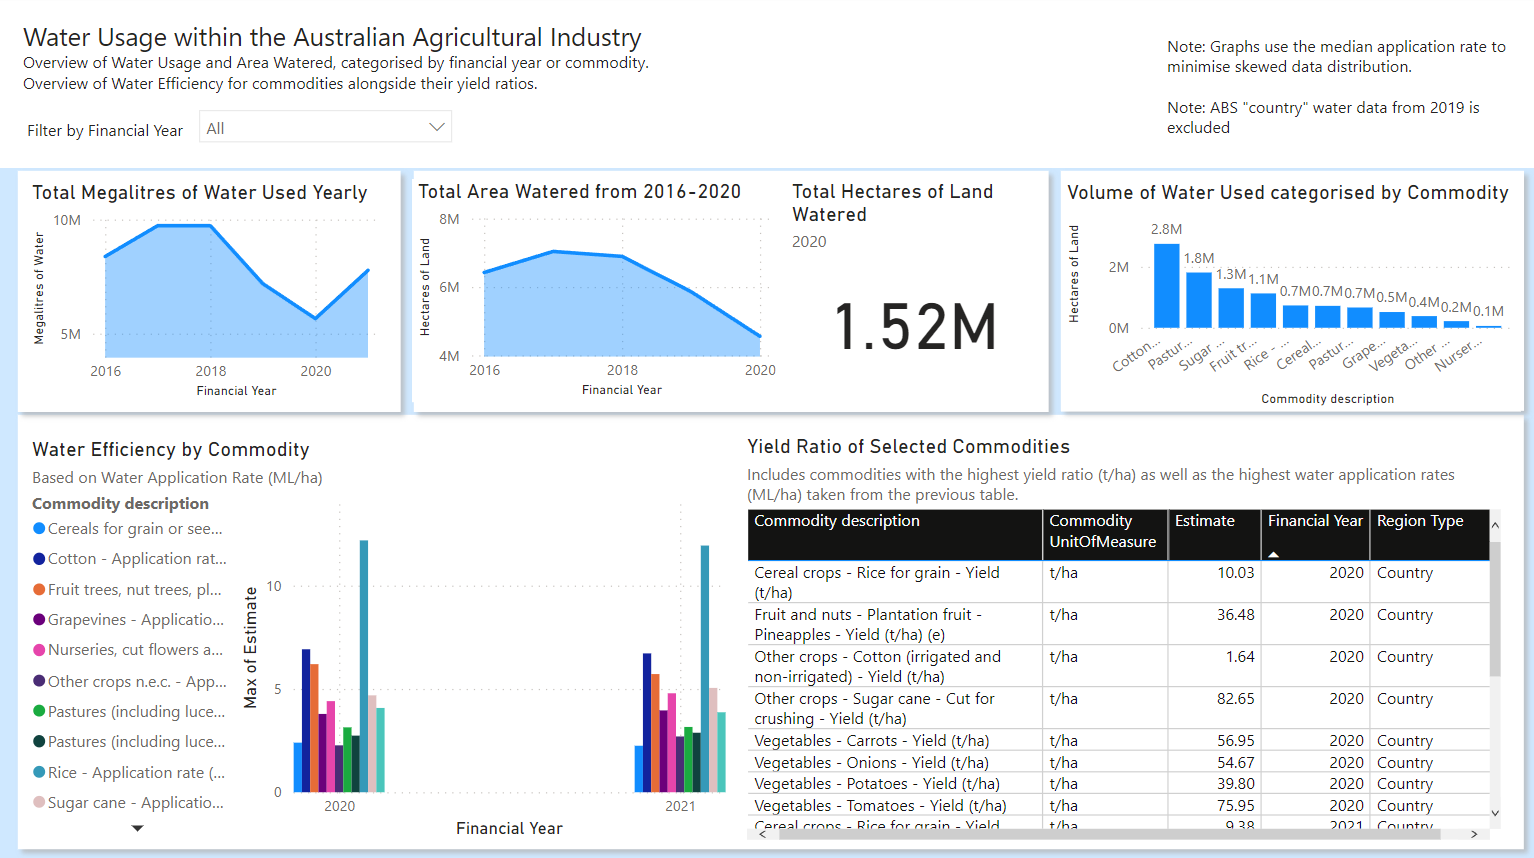
Water usage and total area of land watered varies greatly year-on year, and is currently trending downwards.
Insight 1: From 2016, the categories of crops that use the highest volume of water has always been some variation of the following:
Pastures
Sugarcane
Fruit trees
Cotton
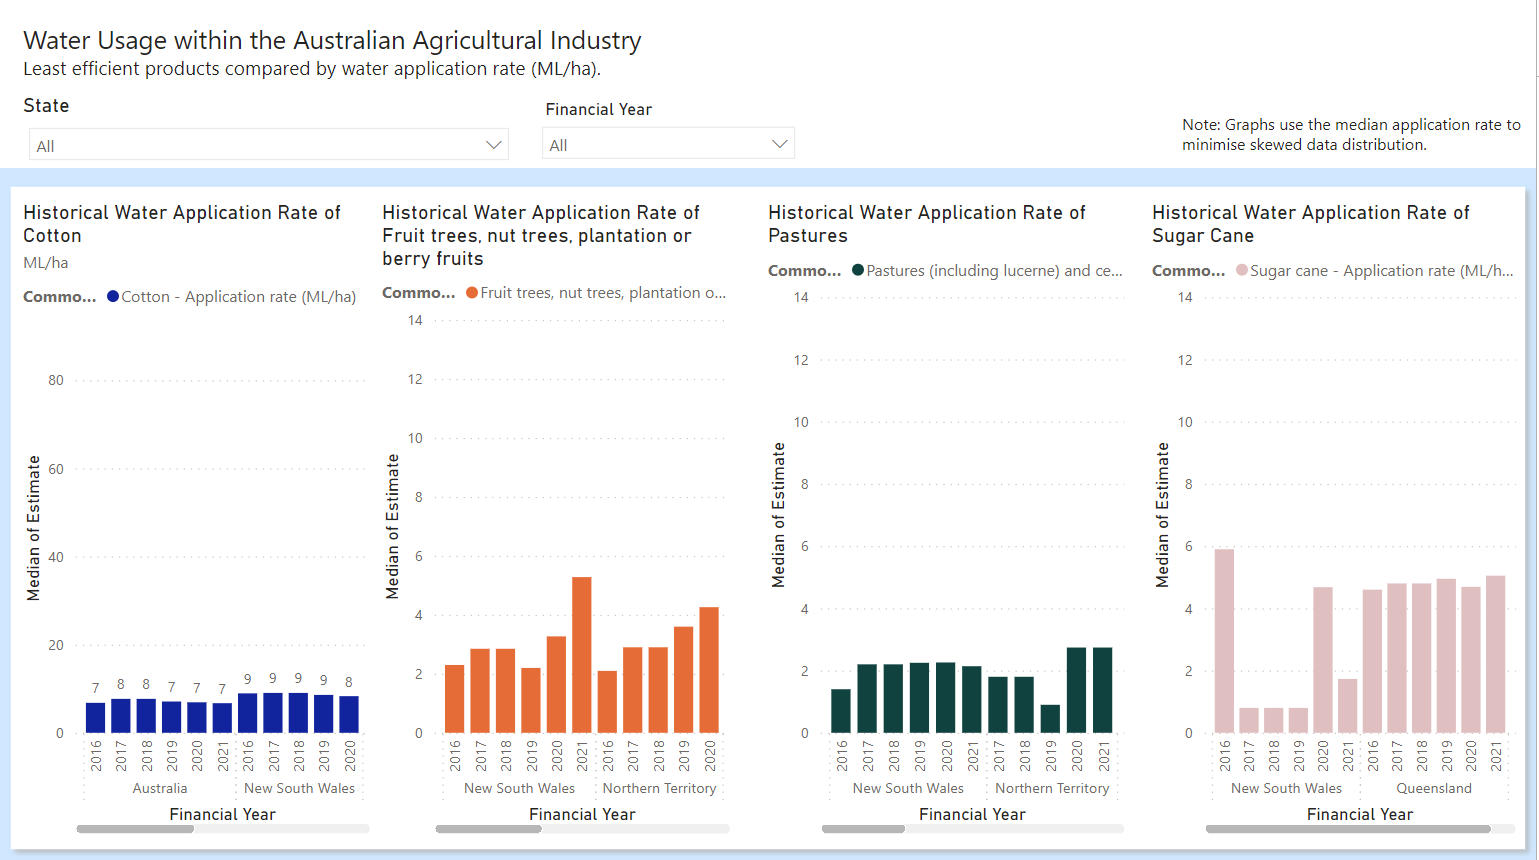
Insight 2: Commodities with the lowest water efficiency has historically been rice, followed by cotton, sugarcane and vegetables. Despite the amount of water these crops use, our yield for these products (t/ha) is high only for sugarcane and certain vegetables. We should focus our attention of poor yield ratio of cotton and rice by improving technology and practices.
Insight 3: Certain states do a better job at producing certain crops. E.g NSW is 500% more effective at growing sugarcane.


